
Surface flow samples
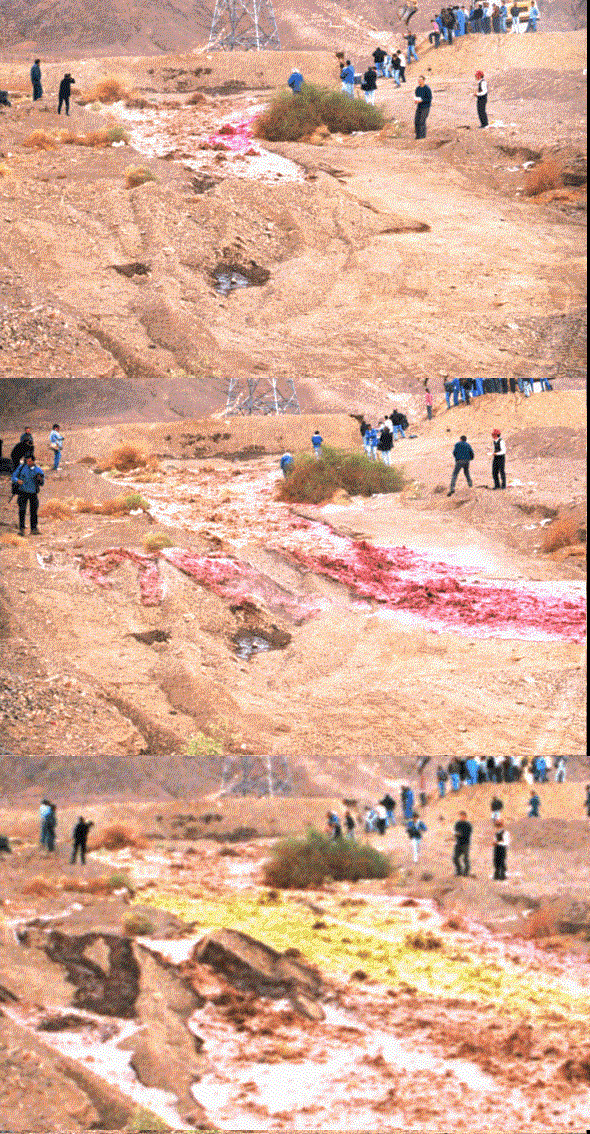
At sampling site 1 the initial background concentration of NaCl was very high as the flood water dissolved natural salt deposits in the channel. The measured concentration of salt declined exponentially and the signal from the injected 15 kg of salt can be seen as a small peak on this recession. SRB showed very high concentrations at the beginning with exponential decline. During the experiment it was observed that this tracer concentrated near the left bank. Being injected at the very beginning of the flood, it proceeded along with the front. At this site UR generally showed low concentrations. Already during the experiment it was noticed that at higher stage, when UR was injected, the flood travelled near the right bank.
Also at sampling site 2 the initial salt background was enormous. The signal caused by the salt injection spread out over small peaks on the overall NaCl recession. Even the first water sample collected from the flood front contained traces of UR (0.05 mg l-1), although this tracer was injected 50 s after the front had passed the site of injection. Hence an estimate of a maximum flow velocity was possible (6.8 m/s). Since the majority of UR travelled close to the right bank, a distinct breakthrough curve was recorded. The concentration of SRB showed characteristics similar to site 1. The peak, however, was significantly reduced, since the majority of SRB passed the site close to the opposite bank.

Fluocapteurs
The tracers adsorbed in the fluocapteurs reflected the incomplete mixing and the different travel paths of the tracers. In general the trapped amounts of Uranine were larger than those of Sulforhodamine. Reasons for this may have been the higher sorptivity of Sulforhodamine or a reduced infiltration during the initial phase of the flood. The highest tracer concentrations were found downstream of the road. A large part of the injected amount of dye tracers travelled further than the location of sampling site 2.
Two fluocapteurs exposed at greater depths, 40 and 60 cm, had small traces of UR. Due to the higher sorptivity on SRB this tracer could not be found. Both samples were located close to the right bank. This was the main route UR travelled downstream. Although two samples are not sufficient to describe the spatial extent of the infiltration within the whole wadi, they provide the maximum depth of the wetting front at two specific points. This information could be used to estimate the magnitude of infiltration during a real flood event (550 mm/h).

